A Frost Diagram is another way of displaying the reduction potentials for the various oxidation states of a given element, X. It shows nE against the oxidation number N: here, E is the reduction potential for the X(N)/X(0) couple, and n is the number of electrons transferred in the conversion of X(N) to X(0).
| The Frost Diagram for NitrogenThe thick black line is for acidic solution, and the dashed line is for basic solution. |
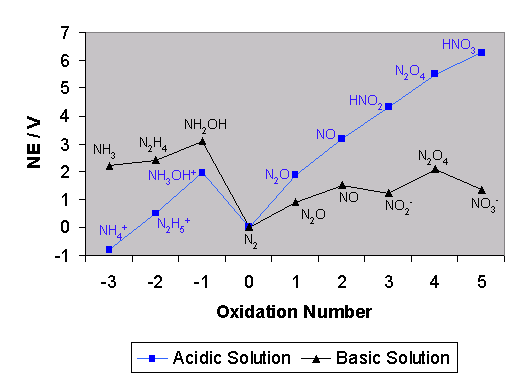 |
Now, nE is proportional to the Gibbs free reaction energy, and so a Frost diagram is in effect a plot of the variation of reaction energy with oxidation number. The slope of the line joining two points on the diagram represents the reduction potential for the couple made from the species at those two points, as predicted by the equation:
![]()
Frost diagrams are most useful as a qualitative description of the processes occurring, and for a quantitative description Latimer diagrams often prove more useful. The appearance of the Frost diagram leads to some useful features.
The steeper the line joining two points in a Frost diagram, the higher the value of the reduction potential for the corresponding couple.
This is a result of the equation above. Thus, the 2/3 couple has a smaller reduction potential that the 3/4 couple in the diagram below.
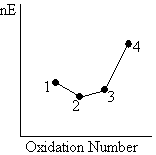 |
When we consider a reaction involving two different couples, we can infer the directions of reactions of the different species, and the ensuing products.
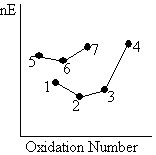 |
In a reaction involving the 6/7 and 3/4 couples:1) The oxidizing agent (4) in the couple (3/4) with the more positive slope, and hence more positive reaction potential, is liable to undergo reduction.
2) The reducing agent (6) in the couple (6/7) with the less positive slope, and hence less positive reduction potential, is liable to undergo oxidation. |
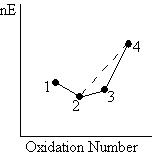
A species in a Frost diagram is unstable with respect to disproportionation if it lies above the line joining the two adjacent species.
 |
This observation stems from the fact that the mean Gibbs free reaction energy for the 2/0 and 4/0 couples lies on the dashed line, below that of the 3/0 couple. Hence the conversion of 3 into 2 and 4 is favourable, as the excess Gibbs free energy will be released. |
| An example is the disproportionation of hydroxylamine, NH2OH [OS(N) = -1] into nitrogen gas, N2, [OS(N) = 0] and ammonia, NH3, [OS(N) = +3]. | |
The corollary of the last observation is that two species in a Frost diagram will tend to comproportionate into the intermediate species which lies below the line joining the two outer species.
 |
This observation stems from the fact that the mean Gibbs free reaction energy for the 2/0 and 4/0 couples again lies on the dashed line, this time below that of the 3/0 couple. Hence the conversion of 2 and 4 into 3 is favourable, as the excess Gibbs free energy will be released. |
| An example is the comproportionation of NH4+ [OS(N) = -3] and NO3– [OS(N) = +5] into N2O [OS(N) = +1]. In solid ammonium nitrate, this is very fast and exoergic, and NH4NO3 is sometimes used as an explosive. | |
Thus a Frost diagram often gives a better idea of the thermodynamics of a the oxidation and reduction of a particular element, whilst a Latimer diagram is more useful when performing calculations on the system in question.